Best Advanced Data Analytics Software in 2026
Explore the top advanced data analytics software of 2026, highlighting AI capabilities, pricing, and industry applications for better decision-making.

Data analytics tools in 2025 are transforming industries with AI-driven insights, predictive analytics, and real-time decision-making capabilities. With the global market projected to reach $132.9 billion by 2026, businesses must choose the right platform to stay competitive. Here are the top contenders:
- Tableau: Known for its intuitive visualizations, AI tools like Tableau Agent, and industry-wide adaptability. Pricing starts at $15/user/month.
- Microsoft Power BI: Seamless integration with Microsoft products, AI assistant Copilot, and affordability at $14/user/month.
- SAS Analytics: A leader in precision analytics, offering SAS Viya for cloud-based solutions. Pricing starts at $8,000 annually.
- Looker (Google Cloud): Focused on semantic modeling and AI-driven insights, with custom pricing averaging $150,000 annually.
- Upskillist: A training platform for mastering analytics tools like Tableau and Power BI, priced at $39.99/month.
Quick Comparison:
| Software | Strengths | Challenges | Pricing |
|---|---|---|---|
| Tableau | User-friendly, strong visualizations | High cost for enterprise use | $15–$75/user/month |
| Power BI | Affordable, integrates with Microsoft | Recent price hikes | $14–$24/user/month |
| SAS Analytics | Advanced analytics, compliance focus | Expensive, complex setup | Starts at $8,000/year |
| Looker | AI-driven, Google ecosystem synergy | Requires SQL skills, costly | Avg. $150,000/year |
| Upskillist | Hands-on training, affordable | Not an analytics tool directly | $39.99/month |
Choosing the right tool depends on your organization's size, budget, and analytics needs. Start small with trials or training (like Upskillist) to ensure your investment delivers measurable outcomes.
Top 5 Data Analytics Tools 2025 | Best Tools For Data Analysis | Data Analytics Software | MindMajix
1. Tableau
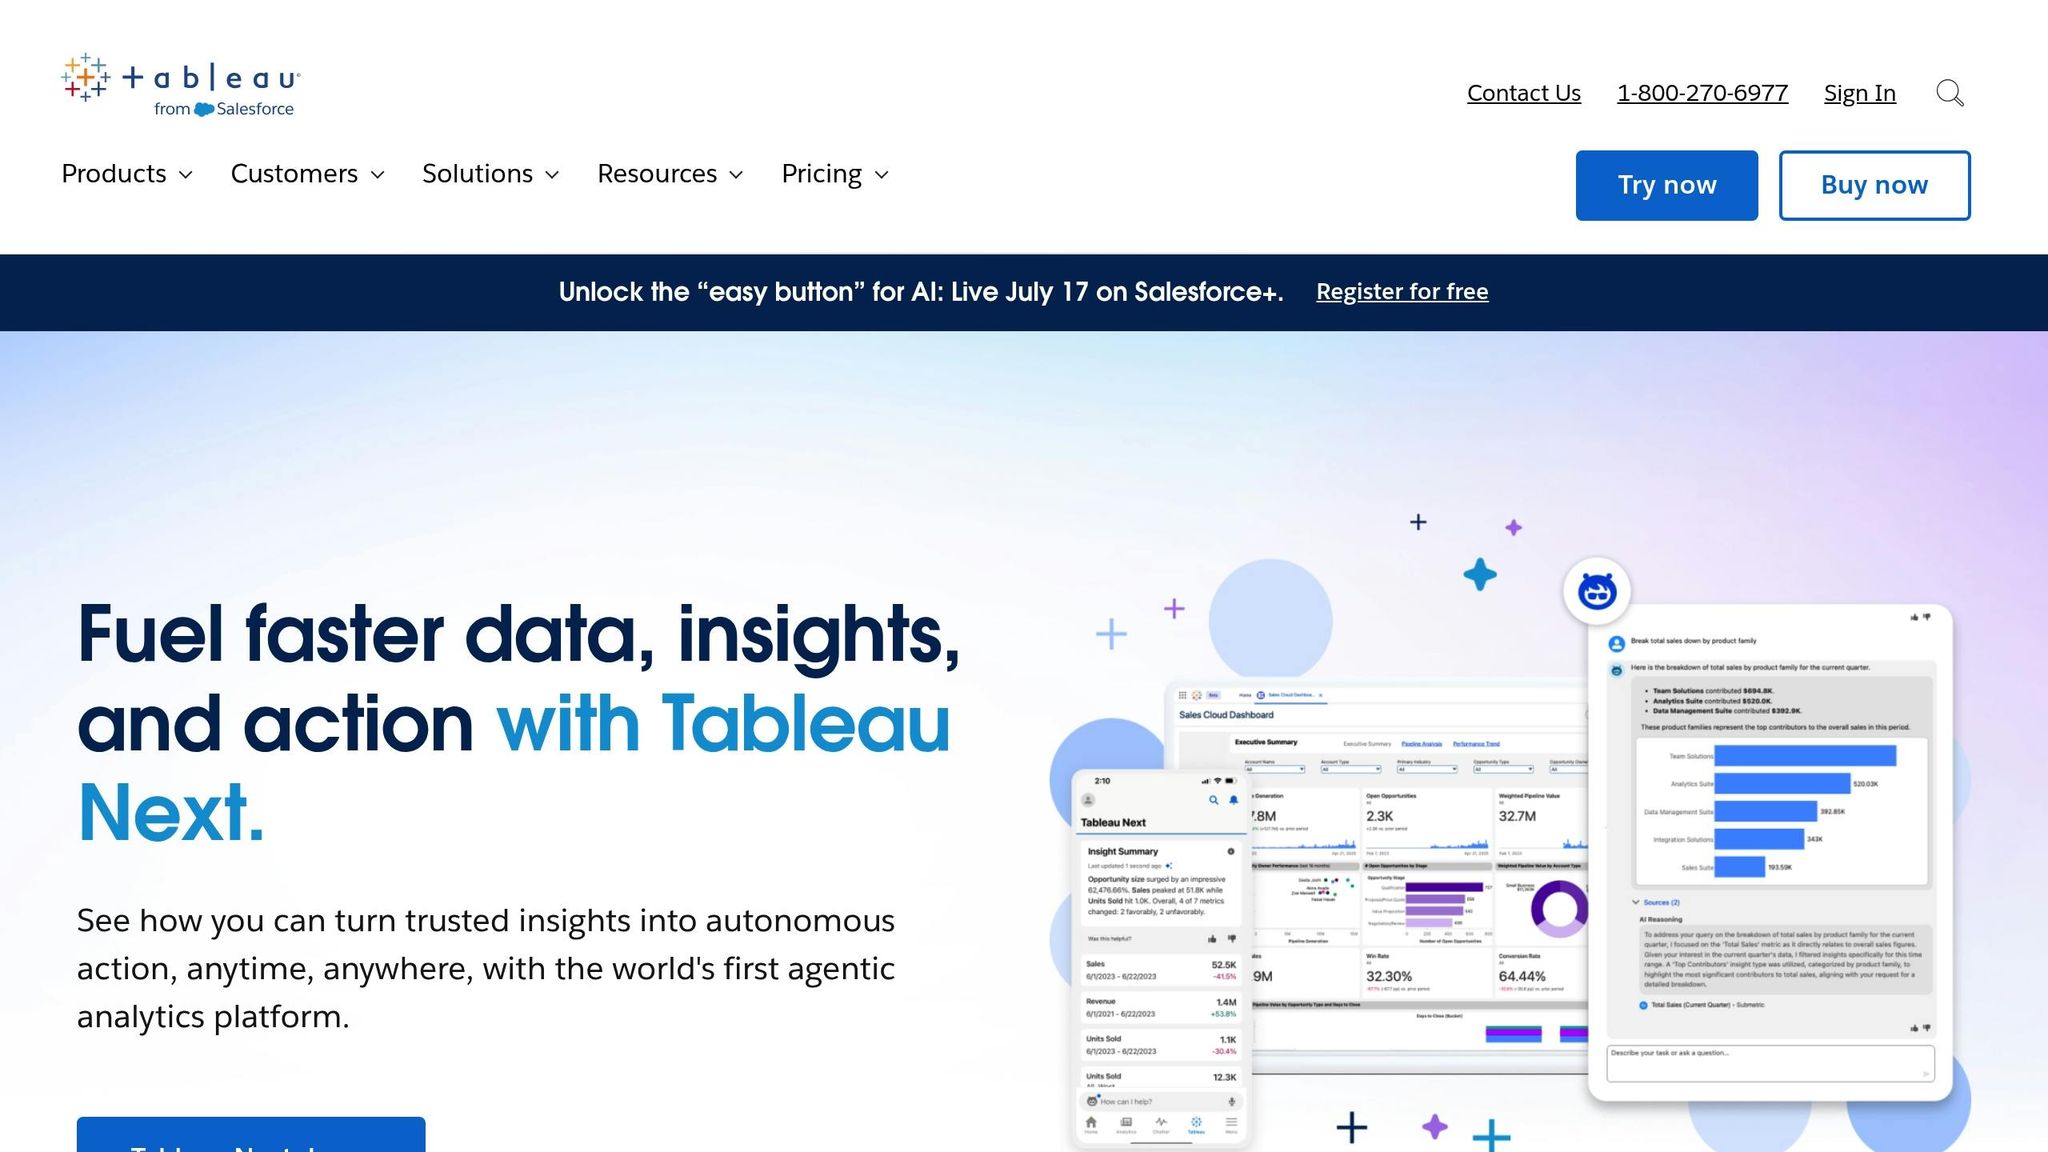
As we move into 2025, Tableau continues to dominate the visual analytics space with its user-friendly drag-and-drop interface. The latest iteration of the platform, Tableau Next, incorporates generative AI and automation to streamline analytics workflows.
"At Tableau, we're committed to helping people make real-time, data-driven decisions powered by generative AI. As we enter the agentic era, every role - from data analysts to site admins - is evolving. Our tools must evolve too, alongside our people and organizations." - Ryan Aytay, President & CEO of Tableau
Features
Tableau's core strength lies in its VizQL technology, which simplifies data exploration. Users can create advanced visualizations without needing to write a single line of code. The platform also includes AI-powered tools like Tableau Agent and Ask Data, enabling users to interact with their data through natural language commands.
Other standout features include:
- Tableau Pulse, which delivers timely insights to decision-makers.
- Data Stories, automating the process of analyzing and communicating insights.
- Dynamic Zone Visibility, allowing for personalized dashboard experiences.
- Table Extensions, enabling deeper analytics through coding and APIs.
- Concierge, which uses natural language to answer questions and provide actionable recommendations.
Use Cases
Tableau's versatility shines across industries. For example, Verizon's Analytics Center of Excellence developed 1,500 dashboards, cutting analysis time in half. Similarly, HelloFresh saved 10–20 work hours daily by automating reporting processes .
Bentley Motors relies on Tableau's drillable dashboards to streamline process management, quickly identify issues, and improve customer experiences. In the education sector, Des Moines Public Schools leveraged Tableau to provide real-time analytics to 7,000 educators, significantly boosting dropout intervention success rates.
Pricing
Tableau offers flexible pricing tailored to different user roles:
- Creator: $75/user/month (billed annually)
- Explorer: $42/user/month (billed annually)
- Viewer: $15/user/month (billed annually)
For Tableau Server, pricing is customized based on enterprise needs. Every deployment requires at least one Creator license, and enterprise editions may include Resource Blocks at $250/month (billed annually).
New customers can seize a limited-time 20% discount on the Enterprise edition, valid through July 31, 2025. Additionally, volume discounts are available for nonprofits, educational institutions, and enterprise clients.
Industry Suitability
Tableau has proven its value across diverse sectors, from telecommunications to manufacturing. For instance, Mercado Libre scaled its Tableau usage fivefold, reaching 12,000 active users. Meanwhile, Coopers Brewery utilized the platform to cut waste and recover 70% of potential revenue loss.
"Our Tableau deployment went viral. In less than two years, we have 20,000 users. And the reason for this success is because we've been able to strike the right balance between empowering the business, enabling better visibility, and instilling trust and governance in the data." - Sherri Benzelock, VP of Business Analytics Transformation, Honeywell
Skill Level
Tableau is designed to cater to users of all skill levels. Beginners can quickly get started with features like Show Me 2.0, which offers easy access to all visualization types. For advanced users, tools like Dynamic Spatial Parameters enhance mapping capabilities. The Data Guide provides essential context about dashboards and data, ensuring everyone - from novices to experts - can navigate the platform effectively.
Organizations using Tableau report a 33% increase in insights-driven decision-making. Up next, we’ll take a closer look at another leading analytics solution to see how it stacks up.
2. Microsoft Power BI
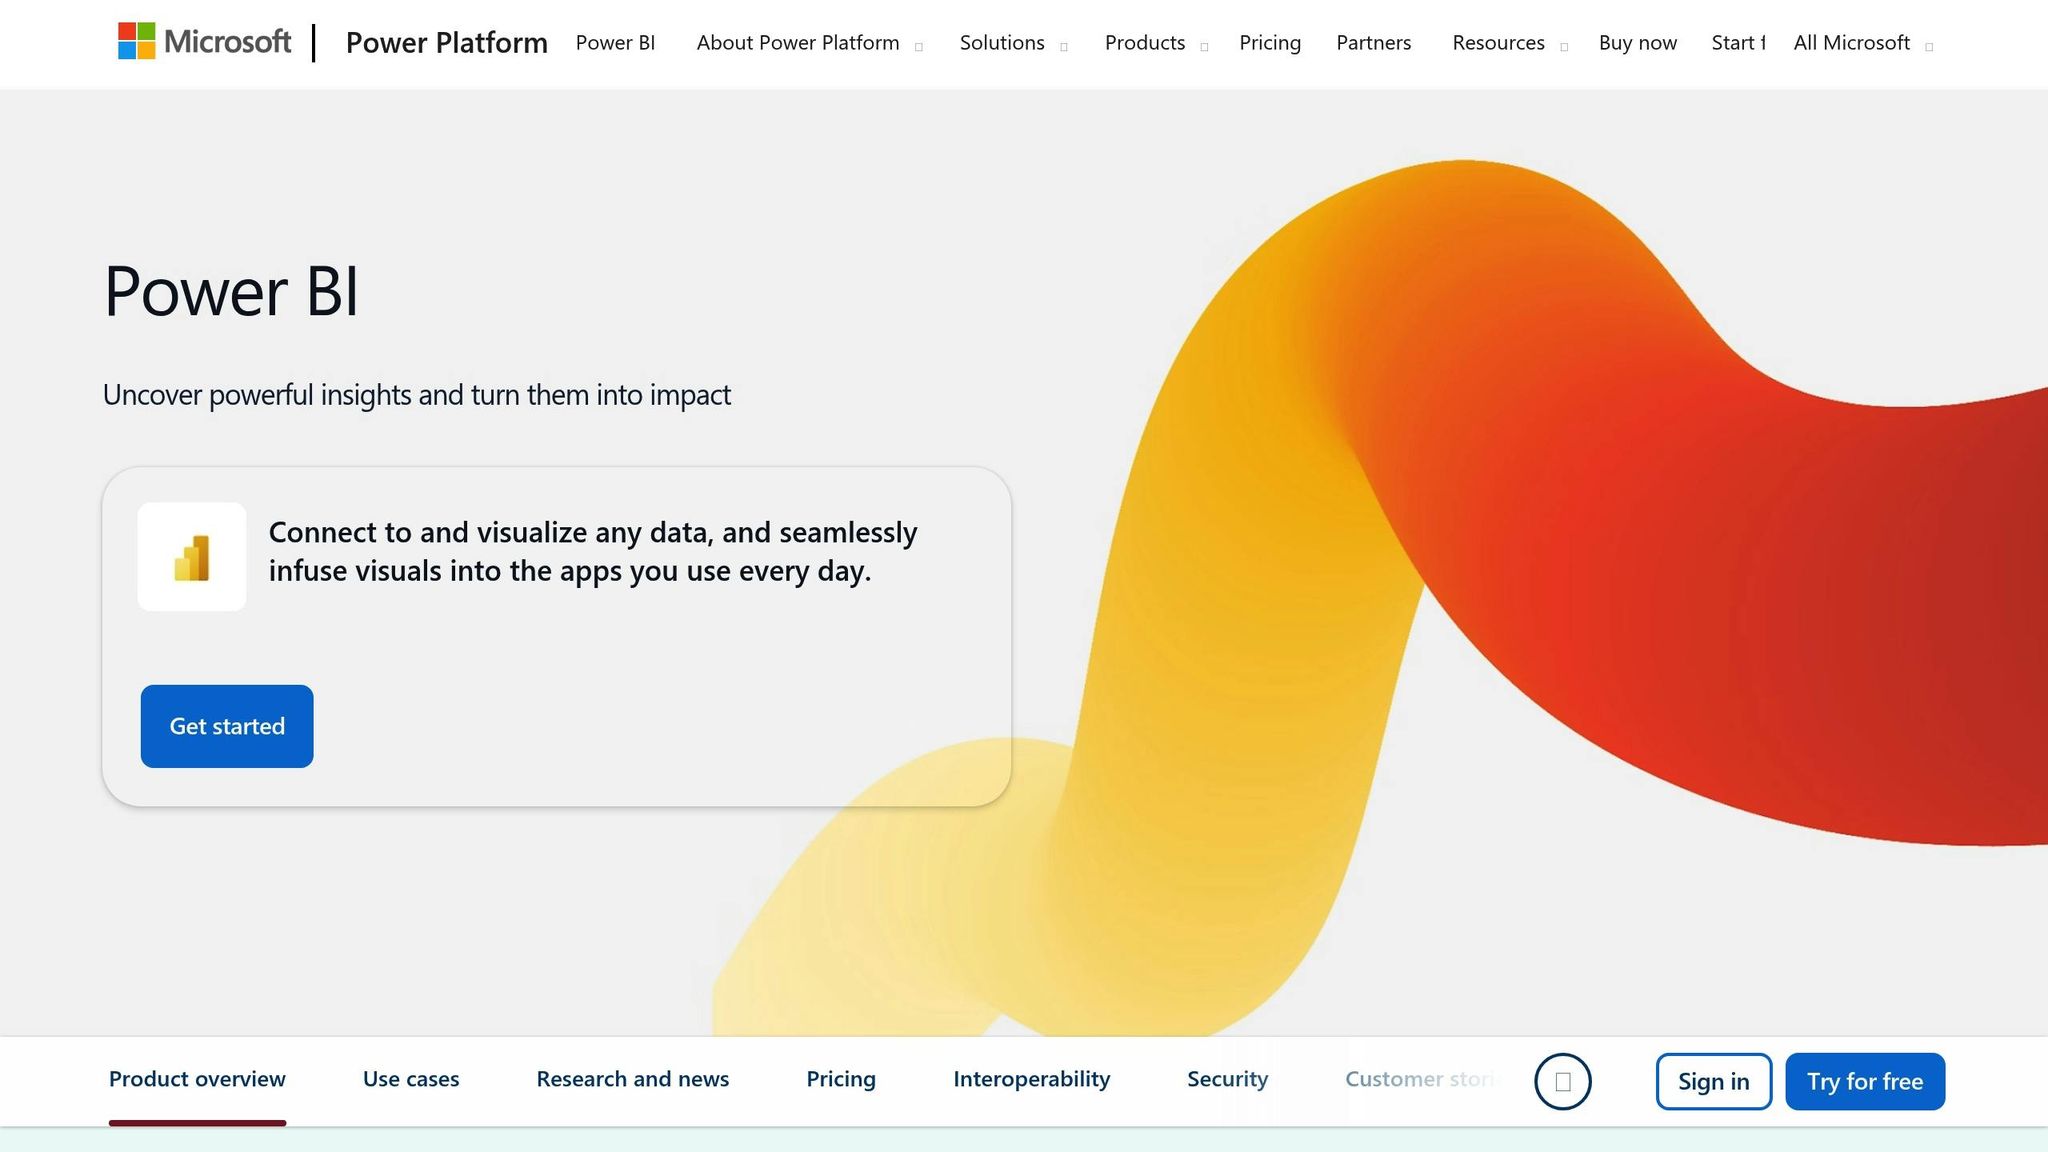
As Microsoft Power BI celebrates its 10th anniversary in 2025, it continues to solidify its position as a leading data analytics platform, now enhanced with AI-powered tools that elevate its capabilities in the analytics space. Over the years, Power BI has grown from a traditional business intelligence tool into a comprehensive solution that integrates seamlessly with Microsoft's ecosystem.
Features
One of the standout additions for 2025 is Copilot, an AI assistant that enables users to interact with their data using natural language queries. Copilot not only understands these queries but also recognizes synonyms, simplifying the process of finding answers without manual data mapping.
Another exciting feature is translytical task flows, which allow users to take action directly from reports by automating data write-back through report buttons. This bridges the gap between analytics and operations, making insights actionable in real time.
To ensure AI delivers accurate and relevant responses, Power BI now includes tools like AI Data Schema, Verified Answers, and AI Instructions. These features embed business logic and domain-specific guidance into AI prompts, refining the platform's ability to provide contextually appropriate insights.
Other updates include persisted sorting for field parameters, visual calculations using LOOKUP functions, and a one-click mobile layout auto-create feature for optimized mobile views. Additionally, desktop performance has been enhanced, though users should note that support for the 32-bit version will end on July 31, 2025.
Use Cases
Power BI is versatile, supporting a wide range of applications across industries:
- Sales and Marketing Analytics: Track campaign performance and ROI across teams, products, and regions.
- Customer Insights: Analyze purchasing patterns and behaviors to enable targeted promotions.
- Supply Chain Management: Monitor inventory, sales velocity, and reorder points to prevent overstocking or stockouts.
- Human Resources: Gain insights into workforce performance and engagement to improve productivity and retention.
- Operations Management: Optimize processes, resource allocation, and project management.
Pricing
In April 2025, Microsoft adjusted Power BI's pricing to reflect its ongoing investments in the platform. The updated pricing structure is as follows:
- Power BI Pro: $14.00 per user/month (billed annually)
- Power BI Premium Per User (PPU): $24.00 per user/month (billed annually)
- Power BI Embedded: Pricing varies by capacity usage
- Microsoft Fabric: Capacity-based licensing with F SKUs
These prices represent increases - Power BI Pro rose from $10 to $14 (a 40% jump), while PPU increased from $20 to $24 (a 20% rise). Microsoft attributes these changes to advancements like AI-powered analytics, improved performance, and enhanced security.
Notably, organizations using Microsoft 365 E5 or Office 365 E5 annual subscriptions with annual billing are exempt from these price changes.
Industry Suitability
Power BI's flexibility makes it valuable across multiple industries:
- Finance: Track real-time cash flow, measure risk, and identify fraud.
- Healthcare: Monitor patient metrics, optimize resources, and ensure compliance.
- Retail: Manage inventory, analyze customer needs, and refine pricing strategies.
- Manufacturing: Predict equipment failures, oversee logistics, and ensure product quality.
- Automotive: Automate vehicle parameter analysis and pricing strategies using tools like Azure OpenAI (GPT-4), reducing manual processes.
- Education: Evaluate student performance, manage faculty resources, and analyze enrollment trends.
- Government: Enhance transparency, track performance, and manage budgets effectively.
Skill Level
Power BI caters to both beginners and advanced users. Its drag-and-drop interface and pre-built templates make it accessible to newcomers, while experienced users can take advantage of advanced AI features, custom calculations, and seamless integration with Microsoft services.
The Copilot feature stands out for its ability to interpret plain English queries, making the platform approachable for non-technical users. On the other hand, technical users can explore advanced analytics and data pipeline management through integration with Microsoft Fabric.
To fully leverage Power BI's capabilities, organizations should transition to the 64-bit version of Power BI Desktop and configure tenant settings for Copilot.
Next, we'll take a closer look at SAS Analytics and its role in the 2025 data analytics landscape.
3. SAS Analytics
As enterprise analytics adapt to meet changing regulatory and strategic needs, SAS Analytics continues to lead the way, especially for organizations requiring advanced statistical tools and strict compliance standards. Heading into 2025, SAS is enhancing its platform with cloud-native features and AI-driven tools, reinforcing its reputation for precision and reliability. Let’s dive deeper into what makes SAS Analytics a standout choice for enterprise-grade analytics.
Features
At the heart of SAS's 2025 offerings is SAS Viya, a cloud-native and cloud-agnostic analytics platform. This flexibility allows organizations to deploy it on their preferred infrastructure without being locked into a specific vendor’s ecosystem.
SAS is heavily integrating AI and machine learning capabilities into its platform. According to SAS leadership, their focus is on transforming AI models into practical tools. One notable addition is natural language processing (NLP), which lets users interact with data using plain English, simplifying complex analytics for a broader audience.
The platform’s SAS Visual Analytics serves as a central hub for data exploration, visualization, and reporting. Recent updates now allow users to directly edit tables in viewing mode, streamlining workflows. SAS also emphasizes real-time analytics and edge computing, enabling organizations to generate insights directly from IoT devices and other edge environments as data is captured. To ensure data integrity, SAS provides comprehensive data management solutions that prioritize privacy and compliance.
Use Cases
SAS Analytics is particularly effective in industries where complex statistical analysis and regulatory compliance are critical.
- Financial Services: Banks use SAS Decision Builder to automate decision-making processes, such as loan approvals, reducing turnaround times. Investment firms rely on SAS to assess real estate deals and manage portfolio risks.
- Healthcare: Hospitals and insurance providers use SAS to predict patient care pathways, manage chronic conditions, and optimize discharge planning. Its precision in clinical research ensures compliance with pharmaceutical regulations.
- Manufacturing: SAS integrates with sensor networks to predict when equipment maintenance or part replacements are needed, helping manufacturers avoid costly production delays.
- Public Sector and Academia: Government agencies automate tax filings and benefit applications, while academic institutions streamline admissions and financial aid processes using SAS.
Pricing
SAS Analytics offers a flexible pricing structure based on deployment type, user count, and organizational needs. For example:
- SAS Visual Analytics starts at $8,000 annually.
- Pricing ranges from $1,500 per user for limited offerings to $10,000 for core capacity implementations, with full-scale enterprise deployments potentially costing millions.
SAS also provides free trials for several products and includes free software updates with technical support. However, the cost can be a barrier for smaller organizations. Tapan Jain, a Data Analyst at Criteo, remarked, “SAS is relatively expensive compared to other BI tools and requires a significant upfront investment”. On the other hand, Ian Macintosh, Manager ICT Operations at the Australian Institute of Health and Welfare, shared, “It is not cheap but it is worth it!”.
Industry Suitability
SAS Analytics is a go-to choice for industries where precision and compliance are non-negotiable. For example:
- Pharmaceutical companies rely on SAS for clinical trials, where accurate data analysis is essential for regulatory approval.
- Financial services leverage SAS for risk management and regulatory reporting.
- Healthcare systems use its predictive analytics to improve patient outcomes and streamline operations.
- Government agencies and academic institutions value SAS for its ability to handle complex workflows while safeguarding data privacy.
However, for organizations with simpler analytics needs or tighter budgets, more straightforward tools might be a better fit.
Skill Level
SAS Analytics is best suited for intermediate to advanced users with a background in statistics or data analytics. While SAS Visual Analytics offers a more user-friendly interface for business users, unlocking the platform’s full potential often requires experienced analysts or data scientists. Many organizations also invest in training and certification programs for their teams, which, while adding to the initial cost, often pays off in improved decision-making and analytics capabilities.
As SAS continues to expand its AI-powered and cloud-based offerings, we’ll next explore how Looker (Google Cloud) approaches modern enterprise data analytics.
4. Looker (Google Cloud)
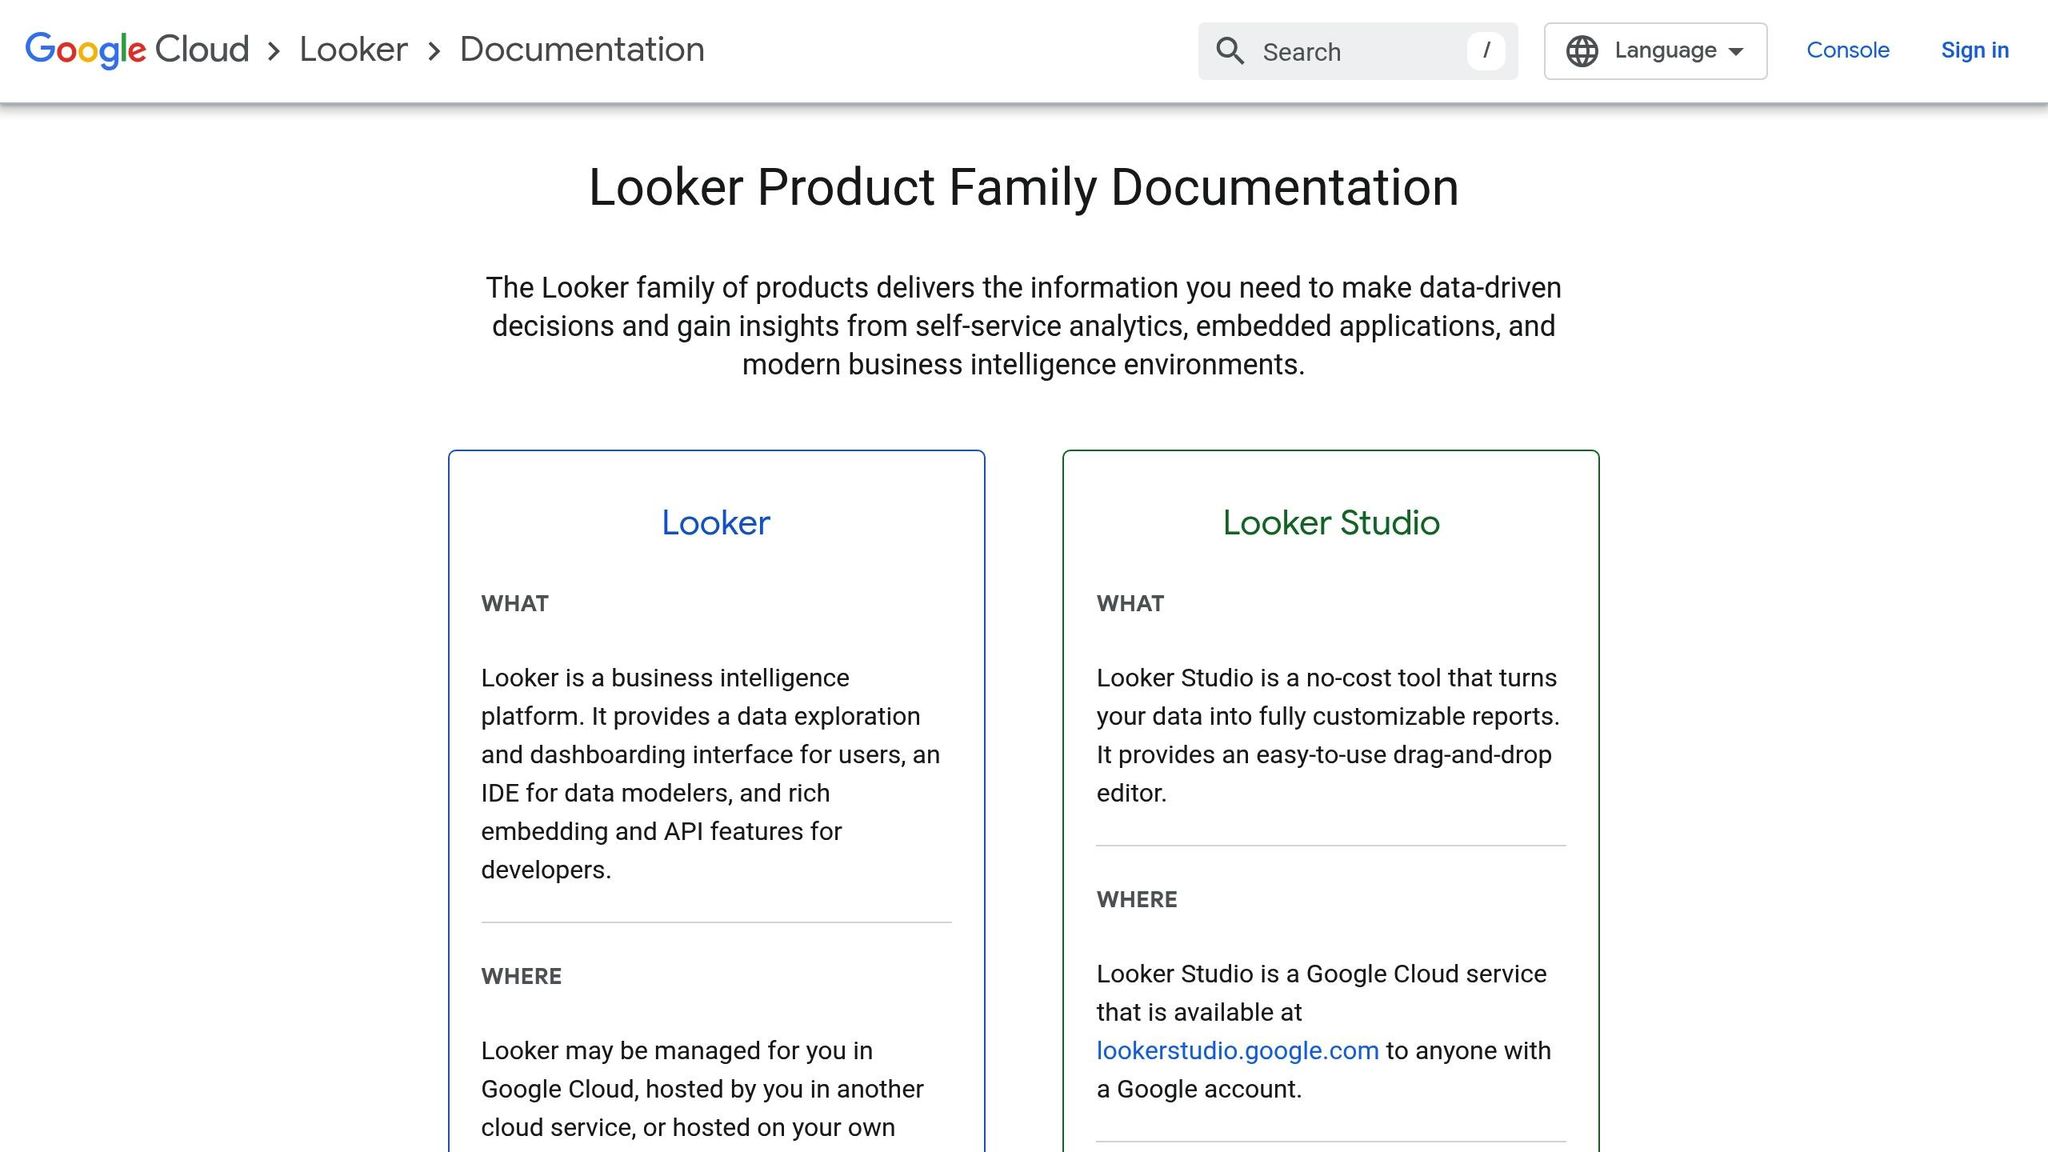
Looker taps into Google's AI to change the way businesses access and interpret data. At its core is a universal semantic modeling layer, ensuring a single source of truth for data while automating insights through natural language interactions. Similar to platforms like Tableau, Power BI, and SAS, Looker pushes the boundaries of AI-driven analytics.
Features
Looker's 2025 lineup brings AI-powered analytics to the forefront, utilizing Gemini models that allow users to interact with data in plain language. The Conversational Analytics feature lets users pose questions without needing to write complex queries. Tools like the Visualization Assistant and Formula Assistant simplify dashboard creation and enable instant calculations. For presentations, the Automated Slide Generation feature crafts slides with key insights directly from your data.
For developers and technical users, Looker offers the LookML Code Assistant and a preview of its Code Interpreter for Conversational Analytics, which supports tasks like forecasting and anomaly detection - no Python expertise required. Additionally, its semantic modeling and CI capabilities automate SQL and LookML validations, ensuring reliable and accurate insights.
These tools collectively make Looker a versatile choice for a wide range of applications.
Use Cases
Looker shines in environments where democratizing data and enabling self-service analytics are priorities. Marketing teams, for example, use Looker with the Google Marketing Platform to analyze first-party data, build custom audience segments, and integrate seamlessly with Google Analytics. Finance teams rely on Looker Studio to consolidate data, identify trends, and make forecasts.
Developers can embed Looker's Conversational Analytics API into custom applications, enabling natural language queries. Organizations can also create end-to-end applications for web, marketing, and sales analytics, making Looker a flexible tool for various industries.
Pricing
Looker follows a custom-quote pricing model, with costs depending on factors like user count, data volume, and features. Based on market data from 355 deals, the average annual cost is around $150,000. Here's a breakdown of typical pricing:
| Edition | Annual Cost | Key Features |
|---|---|---|
| Standard Platform | $66,600 | 10 Standard Users, 2 Developer Users, 1,000 API calls/month |
| Advanced Platform | $132,000 | 100,000 Query API calls, 2 Looker Servers |
| Elite Platform | $198,000 | 100,000 Admin API calls, 8 Looker Servers |
Licensing costs for Viewer, Standard, and Developer/Admin users are approximately $400, $799, and $1,665, respectively. Looker Studio Pro is available at $9 per user per project each month. Businesses should also budget for additional expenses like data warehouse usage, onboarding, and training.
Industry Suitability
Looker is well-suited for both public and private sectors. In government, agencies use Looker for data-driven policymaking, resource allocation, and transparent reporting, including performance and budget tracking. In the commercial world, Looker supports sales analysis, marketing strategies, operational efficiency, and customer insights. Its robust security measures, including FedRAMP compliance, make it a strong choice for federal agencies requiring strict data governance.
Marketing-focused companies benefit from its integration with the Google Marketing Platform, while financial institutions leverage its predictive tools for risk management and regulatory reporting.
Skill Level
Looker caters to a broad range of users. Business professionals can extract insights using Conversational Analytics and pre-built reports without needing technical expertise. However, for advanced tasks like customizing models or managing data governance, intermediate to advanced knowledge of LookML is often required. Many organizations invest in training programs to fully utilize Looker's capabilities.
"Looker's unique foundation is its semantic layer, which ensures everyone works from a single source of truth. Combined with Google's AI, Looker now delivers intelligent insights and automates analysis, accelerating data-driven decisions across your organization." - Peter Bailis, VP, Engineering
With Looker's cutting-edge AI and semantic modeling laid out, the focus now shifts to how Upskillist is shaping data analytics education.
5. Upskillist Data Analytics Courses and Tools

Upskillist goes beyond traditional analytics software by focusing on hands-on training that equips learners with practical, job-ready analytics skills. Building on the foundation of Shaw Academy, Upskillist has reached over 30 million students worldwide, offering specialized education in data analytics. While tools like Tableau and Power BI are powerful for analytics, Upskillist ensures users can confidently master these platforms through targeted education.
Features
Upskillist's Data Analytics Program offers self-paced courses that range from beginner to advanced levels. The curriculum includes practical training in Python, SQL, Excel, and even the basics of machine learning, enabling learners to work with industry-standard tools.
The platform incorporates AI-driven tools like Compass AI and Pathfinder to customize learning paths for each student. With interactive online classes, regular assessments, and lifetime access to materials, the program ensures a well-rounded learning experience. Each course module provides 20 hours of practical content, free assessments, and certificates accredited by the CPD Certification Service. Completing all four core modules earns learners an e-Diploma.
Use Cases
Upskillist's courses cater to professionals at different career stages, making it an excellent option for those looking to pivot or advance their careers in data analytics. For businesses, the Enterprise plan includes features such as employee skill gap analysis, data-driven insights, and customizable branding. These capabilities are especially beneficial for companies aiming to enhance their workforce's analytics expertise.
Pricing
The platform operates on a subscription model priced at $39.99 per month, which includes a 7-day free trial. Subscribers gain unlimited access to new content and updates, ensuring they stay up to date with the latest analytics trends.
Industry Suitability
Upskillist is ideal for organizations that want to develop analytics capabilities across various departments. The flexibility of the Enterprise solution supports teams with diverse skill levels and locations. Features like customizable branding and skill gap analysis help align training programs with specific business needs.
Skill Level
The courses are structured to simplify complex topics, making data analytics approachable for beginners while still offering depth for seasoned professionals. With an "Excellent" rating from 3,937 reviews on Trustpilot, Upskillist has proven itself as a trusted resource for turning theoretical knowledge into practical expertise.
This structured and hands-on approach highlights the platform’s ability to bridge the gap between learning and real-world application, setting the foundation for further evaluation of data analytics solutions.
Advantages and Disadvantages
After reviewing the platforms in detail, here's a consolidated look at their strengths and limitations to help guide your decision-making. Each data analytics tool offers specific benefits and drawbacks, which can significantly influence organizational performance.
For rapidly growing companies, scalability and cost management are crucial. Analytics systems must handle fluctuating data volumes and processing demands while staying budget-friendly. Balancing upfront costs with long-term returns is especially important when considering enterprise-level solutions. Below, we've summarized the key advantages and disadvantages of each platform to help you evaluate which one aligns best with your organization's analytical needs.
| Software | Key Advantages | Key Disadvantages |
|---|---|---|
| Tableau | Exceptional visualization tools; connects to numerous data sources; AI-powered insights; excels in predictive analytics for industries like retail, healthcare, and finance | High cost; pricing can be a barrier for new users or light usage scenarios |
| Microsoft Power BI | Integrates seamlessly with Microsoft products; accessible across multiple platforms; affordable at $14/user/month; ideal for finance, HR, and operations teams | Recent price hikes of up to 40%; encourages adoption of other Microsoft tools |
| SAS Analytics | Advanced data management; top-tier accuracy and security; widely trusted in healthcare, finance, and government sectors | Expensive and complex; requires skilled professionals; longer setup times |
| Looker (Google Cloud) | Strong SQL-based data exploration; excellent integration with Google BigQuery, making it a favorite for eCommerce | Limited compatibility outside Google’s ecosystem; needs SQL expertise; less user-friendly for non-technical users |
| Upskillist | Focus on skill-building with hands-on training; AI-driven personalized learning; affordable subscriptions; lifetime access to materials; offers accredited certifications | Not designed for direct analytics use; requires time investment for learning; operates on a subscription basis |
The level of technical expertise required is another key factor. For instance, SAS Analytics often demands highly skilled professionals, which can increase operational costs. On the other hand, Power BI offers a more user-friendly interface, making it accessible to users with a range of technical abilities.
Privacy and compliance are also critical considerations. Platforms must adhere to regulations like GDPR and CCPA. Larger platforms generally include robust security features, but smaller organizations may only access these at higher pricing tiers.
Some organizations opt for custom-built solutions to maintain a competitive edge. Ultimately, the right choice depends on your current infrastructure, specific needs, and future growth strategy. Carefully weighing these trade-offs ensures your software aligns with both immediate goals and long-term plans.
Conclusion
After evaluating various platforms, it’s clear that selecting the right data analytics software in 2025 hinges on aligning the tool’s features with your organization’s unique needs. A thoughtful decision requires balancing your specific goals, budget, and technical readiness. This approach ensures your investment not only meets immediate demands but also supports long-term growth.
Start by identifying your core requirements. Each platform excels in different areas, so your choice should complement your existing infrastructure and address your primary use cases.
Budget is another critical factor. Pricing models vary widely, so weigh the cost against the value of the platform’s features. Keep in mind that organizations leveraging data-driven strategies can see productivity gains of up to 63%. When implemented effectively, the return on investment can far outweigh the initial expense.
Don’t overlook technical expertise. As Murugan Anandarajan of Drexel University's LeBow College of Business explains, "Being prepared for AI is not just about the technology, it's about preparing your people. You need to upskill them, you need to create AI champions who can lead, inspire, and drive change". Upskilling your team ensures they can fully utilize the software’s capabilities.
To bridge potential skill gaps, platforms like Upskillist offer tailored training. With a 4.8/5 rating and over 3,937 reviews, their Certificate in Data Analytics program covers essential tools like Tableau, Excel, R, and foundational statistics. These courses are designed to prepare users to maximize the value of their analytics tools.
Trial periods and demos are invaluable. Use them to validate a platform’s features and measure its return on investment. Start with small, focused projects to demonstrate ROI before scaling up. The US Bureau of Labor Statistics predicts a 23% growth in data analyst roles by 2032, with average salaries reaching $111,000 in 2025. Investing in these skills is not only smart for businesses but also for individual career growth.
Whether you’re drawn to Tableau’s visualization strengths, Power BI’s seamless integrations, SAS’s enterprise-grade capabilities, or Looker’s cloud-native design, the key to success lies in skilled users. Upskillist’s expert-led courses and AI-driven learning tools provide the knowledge needed to turn software investments into measurable business outcomes. By pairing the right platform with the right skills, organizations can transform technology into a powerful competitive edge.
FAQs
What should I look for when selecting the best data analytics software for my organization in 2025?
When selecting data analytics software in 2025, it's essential to focus on tools that provide smooth data integration, real-time analytics, and the ability to grow with your organization’s demands. A clean, user-friendly interface paired with advanced features like predictive modeling and customizable dashboards can make it easier for your team to uncover actionable insights.
Equally important is ensuring the software offers robust data security and governance to safeguard sensitive data. Opt for solutions compatible with major cloud platforms like AWS, Google Cloud, and Microsoft Azure to keep pace with the increasing reliance on cloud-based systems. Tools with automated quality checks and built-in collaboration features can also boost productivity and improve decision-making processes. Ultimately, choose a platform that fits your industry, your team’s expertise, and your long-term objectives.
How do AI-powered features in data analytics tools improve decision-making in 2025?
AI-Powered Features in Data Analytics Tools
Advanced data analytics platforms like Tableau and Power BI are changing the way decisions are made. By integrating predictive insights, real-time data analysis, and personalized recommendations, these tools simplify complex processes and make data-driven decision-making more accessible.
Take Tableau, for instance. Its AI capabilities provide smart data suggestions and automate workflows, cutting down the time it takes to extract meaningful insights. Meanwhile, Power BI uses AI to create tailored dashboards, refine key performance indicators (KPIs), and analyze user behavior on the fly. These features not only improve efficiency but also give professionals the confidence to make strategic choices backed by data.
What are the costs of advanced data analytics software, and how can businesses maximize their ROI?
The price tag for advanced data analytics software varies widely, starting at around $100 for basic tools and climbing to over $500,000 for enterprise-grade solutions. The cost typically hinges on factors like the software's features, scalability, and licensing structure.
To get the most out of your investment, it's essential to tie software purchases to specific business objectives, such as streamlining decision-making processes or cutting operational expenses. Look for tools that deliver measurable results and invest in proper employee training to ensure the software is used to its full potential. Many companies find these tools pay for themselves within about 18 months, thanks to improved efficiency and actionable insights.
With the data analytics industry expected to expand rapidly, choosing the right tools today could set your business up for a competitive edge in the future.